

About
The Business Inflation Expectations Survey (BIES) provides ways to examine the amount of slack in the economy by polling a panel of business leaders about their inflation expectations in the short and medium term.
The survey asks questions about year-ahead cost expectations and factors influencing price changes, such as profit, sales levels, etc. The survey is unique in that it goes straight to businesses, the price setters, rather than to consumers or households, to understand their expectations of the price level changes. One major advantage of BIES is that one can get a probabilistic assessment of inflation expectations and thus a measure of uncertainty. It also provides an indirect assessment of overall demand condition of the economy. Results of this will thus be useful in understanding the inflation expectation of business and complement other macro data required for policy making.
Frequently Asked Questions
What is the purpose of the survey?
Inflation expectations are one of the main drivers of current inflation, because expected inflation influences current wage negotiations, price setting, financial contracting for investment and consumption. These are also used to generate inflation forecasts. If economic agents view the central bank as credible, inflation expectations are more likely to be well anchored, further enhancing the effectiveness of monetary policy. Also better anchored inflation expectations lead to lower inflation persistence. Because of this link, central banks can affect current and future inflation by better anchoring agents' expectations of long-term inflation. Therefore, understanding inflation expectations are critical for achieving price stability. But our understanding of inflation expectations is limited. This is partly due to measurement issues as they are not directly observed. That is why Bernanke (2007) called for more emphasis on incorporating learning and imperfect information in the modelling of inflation and of inflation expectations. While understanding inflation expectation of household is important, it is also imperative to capture expectations of firms and business owners. Since business representatives participate directly in setting prices and wages, more insight into the inflation expectations of price setters over different time horizons would be helpful for policy-makers. Availability of this data has enormous potential for research and macroeconomic policy making, particularly for monetary policy. This has gained further importance as the Reserve Bank of India (RBI) has formally moved to inflation targeting. This data will be valuable for firms/companies for setting their own business goals as well.
How is the survey conducted?
Each month, during the second week, panelists receive an e-mail with a secure link to the online survey. The survey is open till the third week of the month.
Who participates in the survey?
Companies are selected based on certain sampling criteria from the list of companies as available with the Ministry of Corporate Affairs (MCA). Approximately 5000 panelists receive the survey each month. Panelists represent businesses from various sectors like manufacturing, wholesale and retail trade, suppliers, transport, construction, etc. The size composition of the panel roughly reflects 39% small, 37% medium and 24% large businesses.
Latest Report
A. Inflation expectations
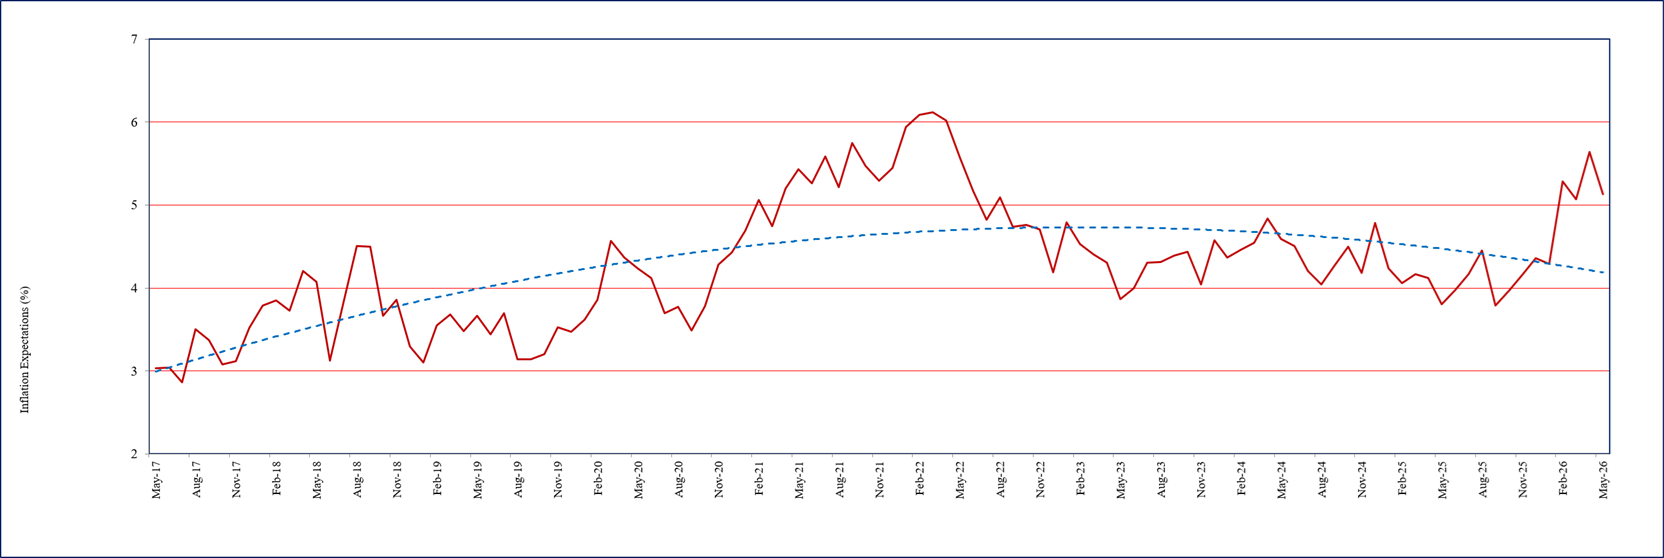
- One year ahead business inflation expectation in May 2026, as estimated from the mean of individual probability distribution of unit cost increase, has sharply declined by 51 bps to 5.13%, from 5.64% reported in April 2026. Firms held their inflation expectations at over 5% for four consecutive months - a phenomenon witnessed only after August 2022. The trajectory of one year ahead business inflation expectations is presented in Chart 1.
- The uncertainty of business inflation expectations in May 2026, as captured by the square root of the average variance of the individual probability distribution of unit cost increase, remained elevated at over 2% for the past five consecutive months.
Chart 1: One year ahead business inflation expectations (%)
B. Costs
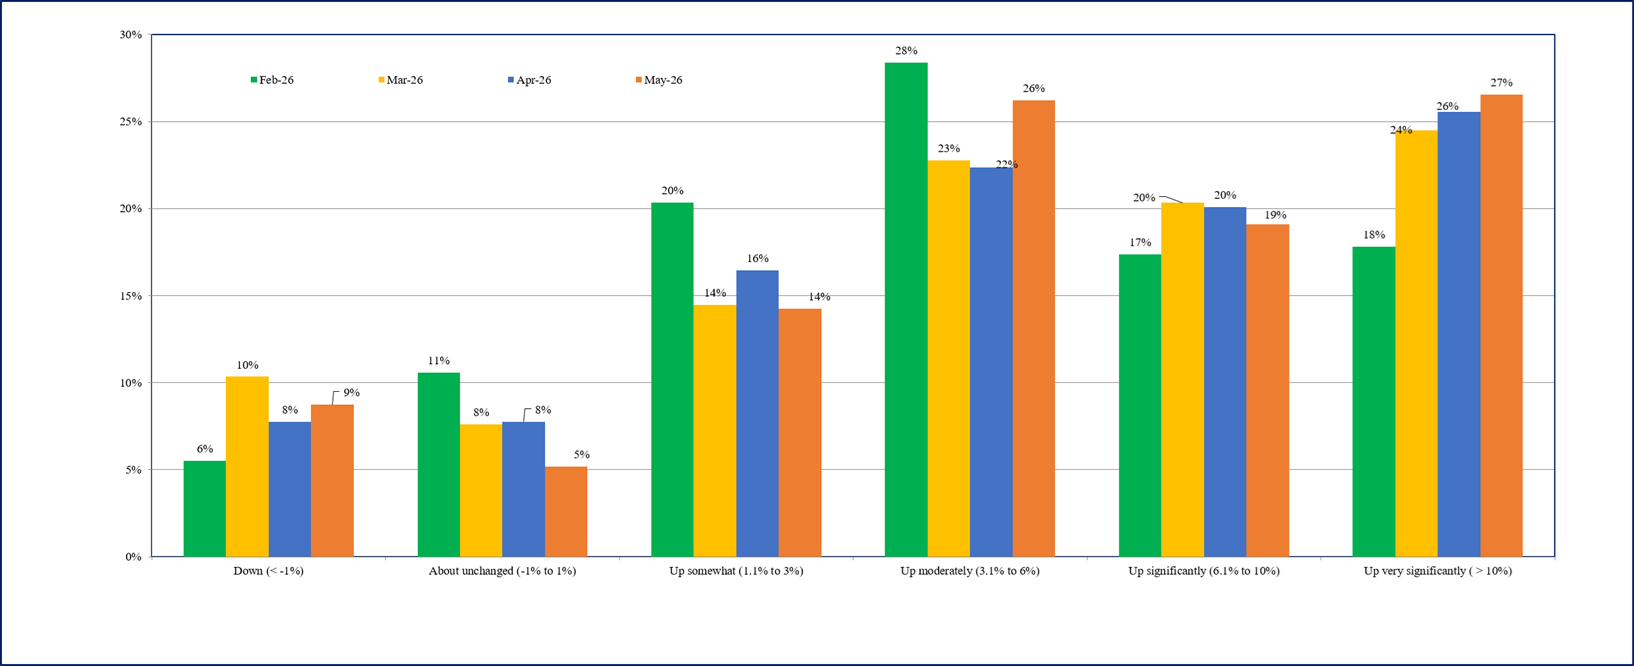
- Overall, the cost perceptions data in May 2026 indicates a mixed signal – the percentage of firms perceiving moderate cost increase (in the range of 3% to 6%) has increased from 22% to 26%.
1The Business Inflation Expectations Survey (BIES) provides ways to examine the amount of slack in the economy by polling a panel of business leaders about their inflation expectations in the short and medium term. This monthly survey asks questions about year-ahead cost expectations and the factors influencing price changes, such as profit, sales levels, etc. The survey is unique in that it goes straight to businesses - the price setters - rather than to consumers or households, to understand their expectations of the price level changes. One major advantage of BIES is that one can get a probabilistic assessment of inflation expectations and thus get a measure of uncertainty. It also provides an indirect assessment of overall demand condition of the economy. Results of this Survey are, therefore, useful in understanding the inflation expectations of businesses and complement other macro data required for policy making. With this objective, the BIES is conducted monthly at the Misra Centre for Financial Markets and Economy, IIMA. A copy of the questionnaire is annexed.
Companies are selected primarily from the manufacturing sector. Starting in May 2017, the “BIES – April 2026” is the 109th round of the Survey. These results are based on the responses of around 1100 companies.
- The percentage of firms perceiving costs ‘up significantly’ and above (over 6%) has remained around 46% for two consecutive months (Chart 2).
Chart 2: How do current costs per unit compare with this time last year? – % responses
C. Sales Levels
- Firms’ sales expectations sharply deteriorated in May 2026.
- Around 65% of firms in May 2026 are reporting ‘much less than normal’ or ‘somewhat less than normal’ sales 2 , sharply up from 57% reported in April 2026 (Chart 3).
Chart 3: Sales Levels - % response
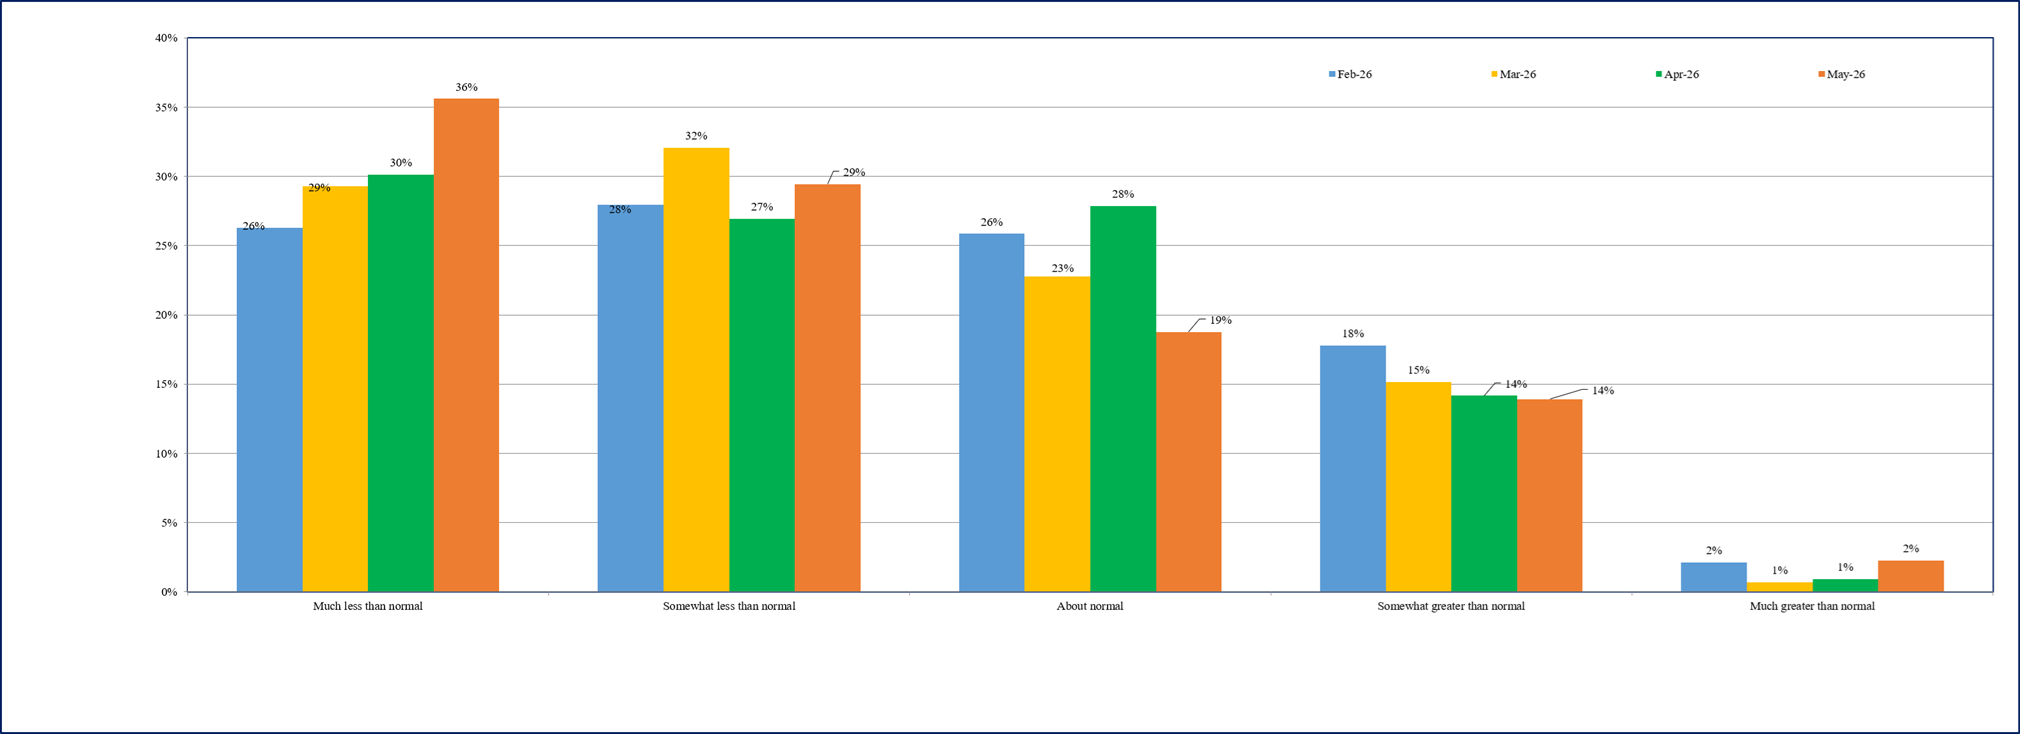
2"Normal" means as compared to the average level obtained in the preceding 3 years, excluding the Covid-19 period.
D. Profit Margins
- The percentage of firms reporting ‘somewhat less than normal’ or below profit margin expectations has shot up to 78% in May 2026 from 72% reported in April 2026 (Chart 4).
- Overall, the profit margin expectations have deteriorated.
Chart 4: Profit Margins - % response
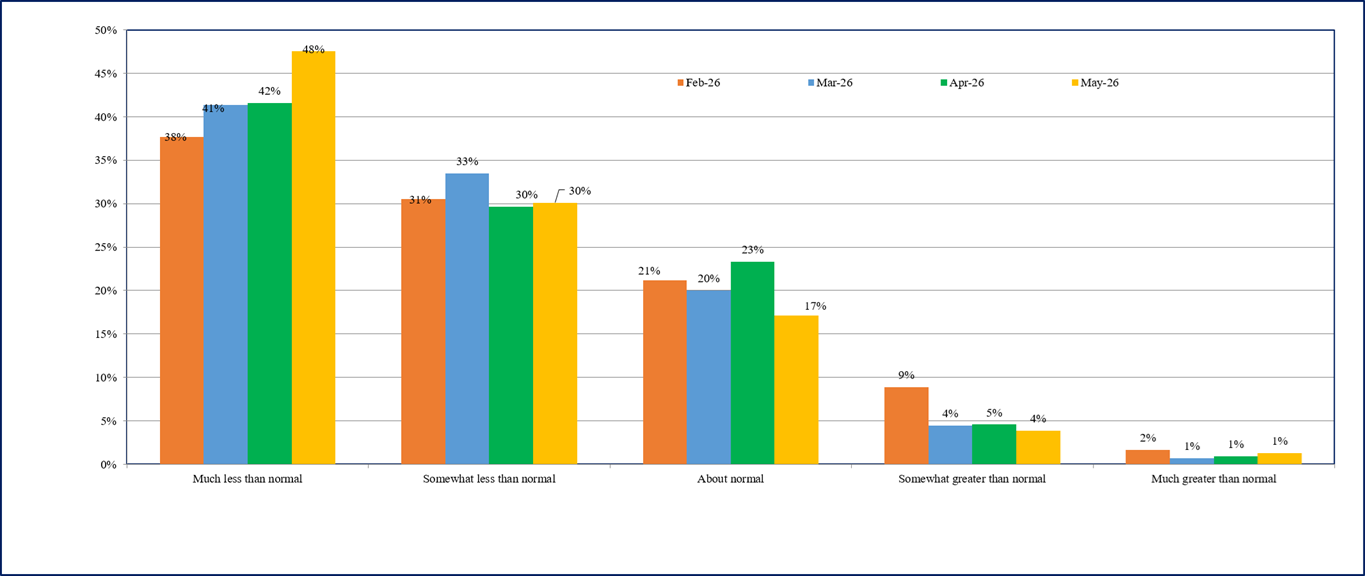
2"Normal" means as compared to the average level obtained in the preceding 3 years, excluding the Covid-19 period.
Business Inflation Expectation Survey (BIES) – Questionnaire
|
A. Current Business Conditions Q1. How do your current PROFIT MARGINS@ compare with "normal" * times? Q2. How do your current sales levels compare with SALES LEVELS@ during what you consider to be "normal"* times? @ of the main or most important product in terms of sales. |
| B. Current Costs Per Unit^ Q3. Looking back, how do your current COSTS PER UNIT compare with this time last year? o Down (< -1%) o About unchanged (-1% to 1%) o Up somewhat (1.1% to 3%) o Up moderately (3.1% to 6%) o Up significantly (6.1% to 10%) o Up very significantly (> 10%) ' of the main or most important product in terms of sales. |
|
C. Forward Looking Costs Per Unit$ o Unit costs down (less than -1%) $ of the main or most important product in terms of sales. |
Latest Report
Business Inflation Expectations Survey (BIES) 1 – February 2025
A. Inflation expectations
-
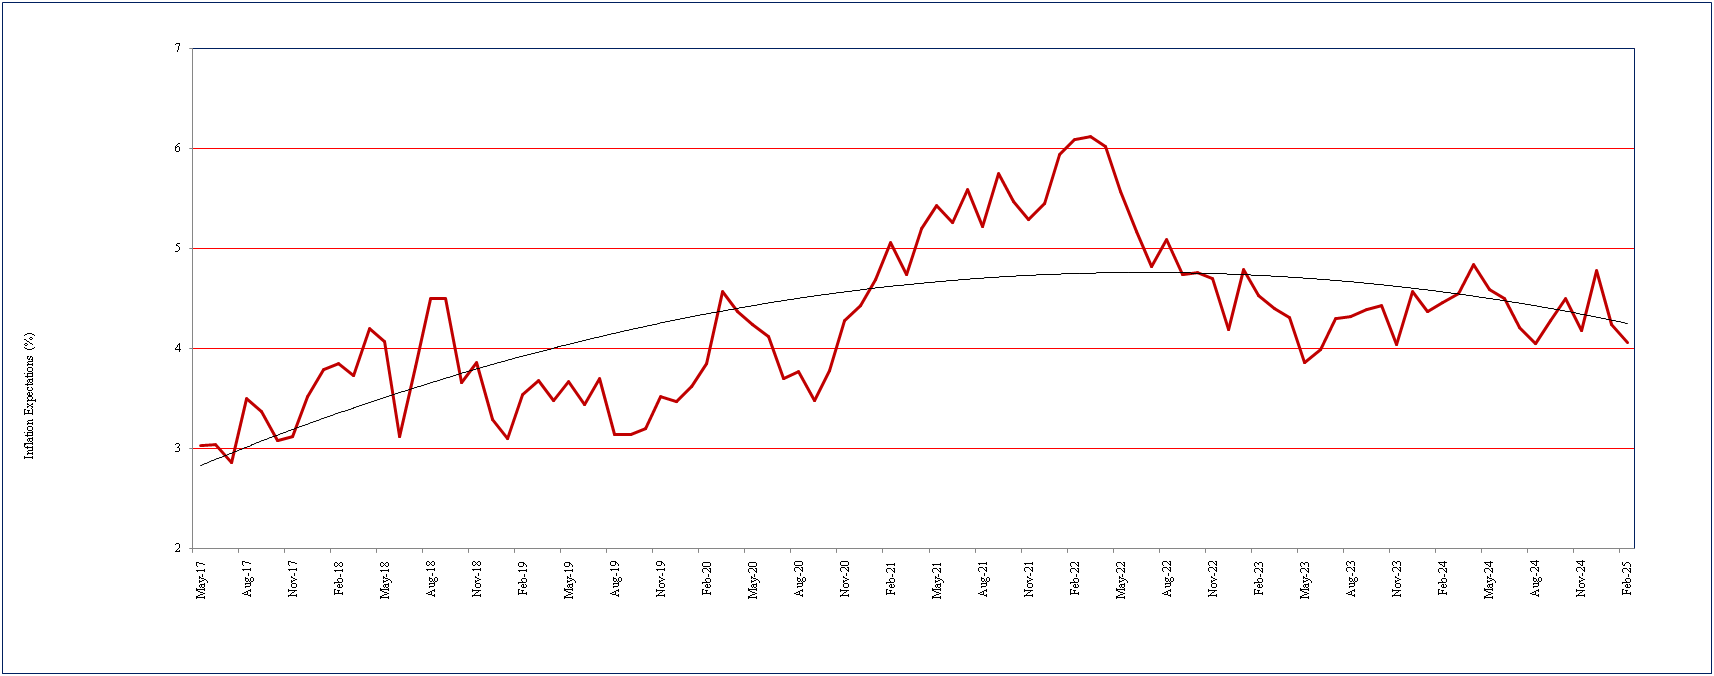
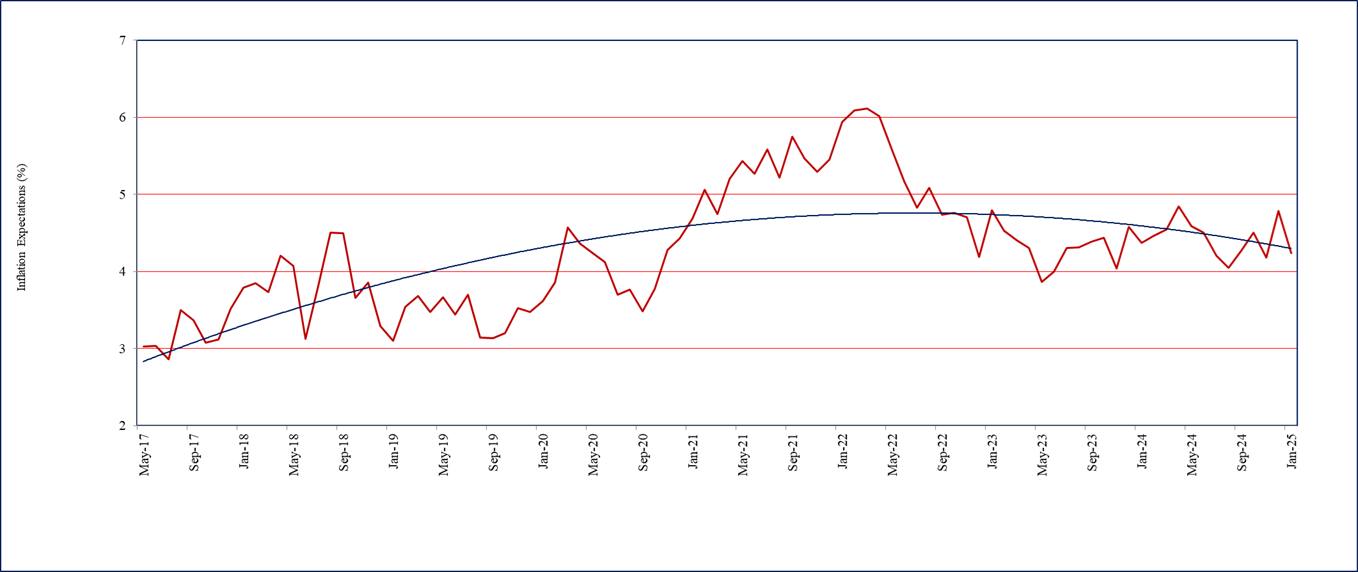
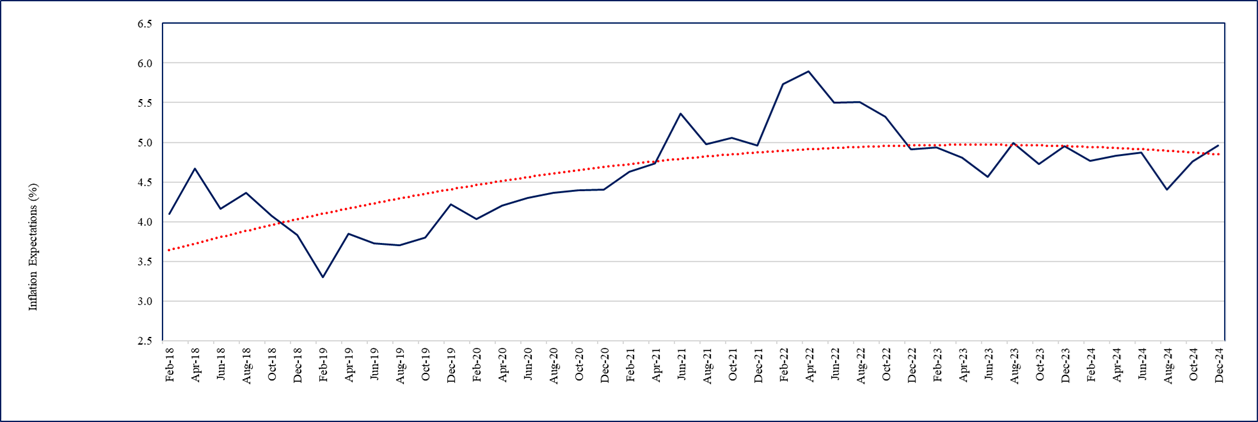
One year ahead business inflation expectation, as estimated from the mean of individual probability distribution of unit cost increase, has further declined by 18 basis points to 4.06% in February 2025 from 4.24% reported in January 2025. Firms’ average inflation expectation during the past 12 months has remained anchored around 4.40%. The trajectory of one year ahead business inflation expectations is presented in Chart 1.
-
The uncertainty of business inflation expectations in February 2025, as captured by the square root of the average variance of the individual probability distribution of unit cost increase, has marginally increased to 1.84% from around 1.81% recorded in the past three rounds.
Chart 1: One year ahead business inflation expectations (%)
- Respondents were also asked to project one year ahead CPI headline inflation through an additional question using a probability distribution. This question is repeated every alternate month, coinciding with the month of RBI’s bi-monthly monetary policy announcement.
1 The Business Inflation Expectations Survey (BIES) provides ways to examine the amount of slack in the economy by polling a panel of business leaders about their inflation expectations in the short and medium term. This monthly survey asks questions about year-ahead cost expectations and the factors influencing price changes, such as profit, sales levels, etc. The survey is unique in that it goes straight to businesses - the price setters - rather than to consumers or households, to understand their expectations of the price level changes. One major advantage of BIES is that one can get a probabilistic assessment of inflation expectations and thus get a measure of uncertainty. It also provides an indirect assessment of overall demand condition of the economy. Results of this Survey are, therefore, useful in understanding the inflation expectations of businesses and complement other macro data required for policy making. With this objective, the BIES is conducted monthly at the Misra Centre for Financial Markets and Economy, IIMA. A copy of the questionnaire is annexed.
Companies are selected primarily from the manufacturing sector. Starting in May 2017, the “BIES – February 2025” is the 94 th round of the Survey. These results are based on the responses of around 1000 companies.
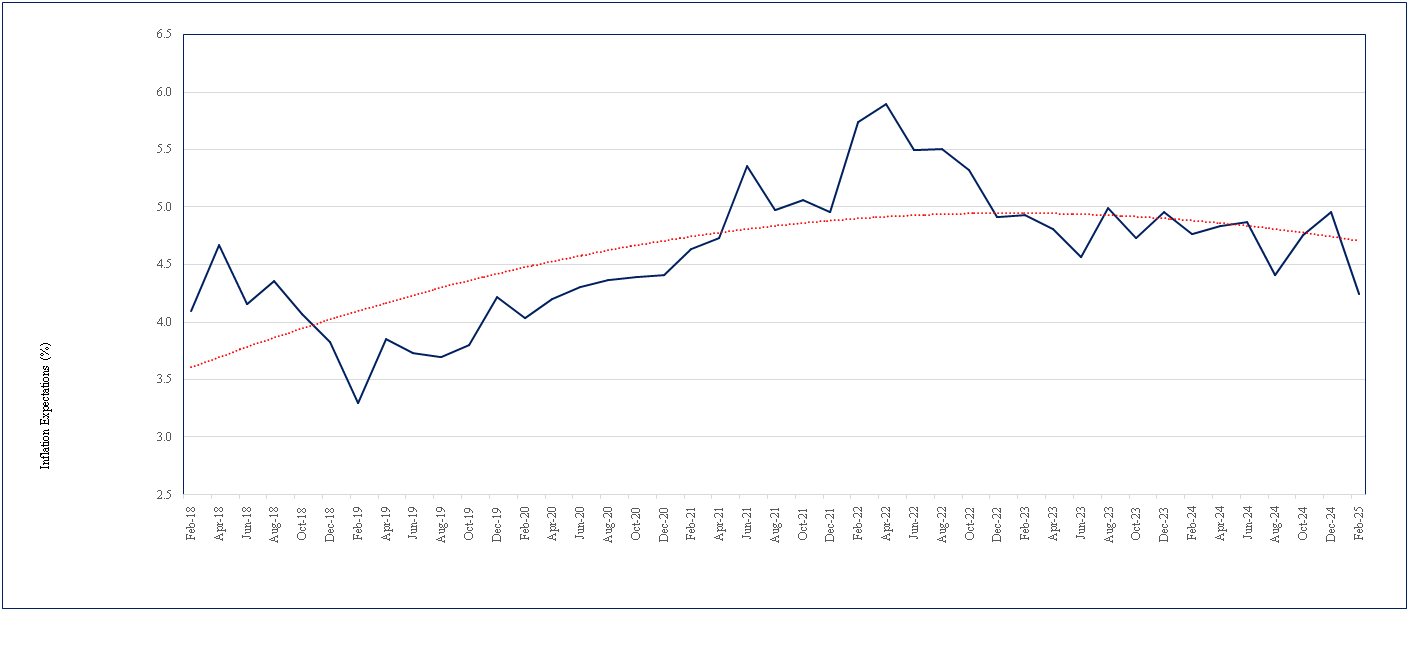
- The businesses in February 2025 expect one year ahead CPI headline inflation to be 4.24%, sharply down by 72 basis points from 4.96% reported in December 2024 (Chart 2). Firms’ uncertainty of CPI inflation expectations remained low at around 0.90% in February 2025.
Chart 2: Expected CPI headline inflation (%) - one year ahead
B. Costs
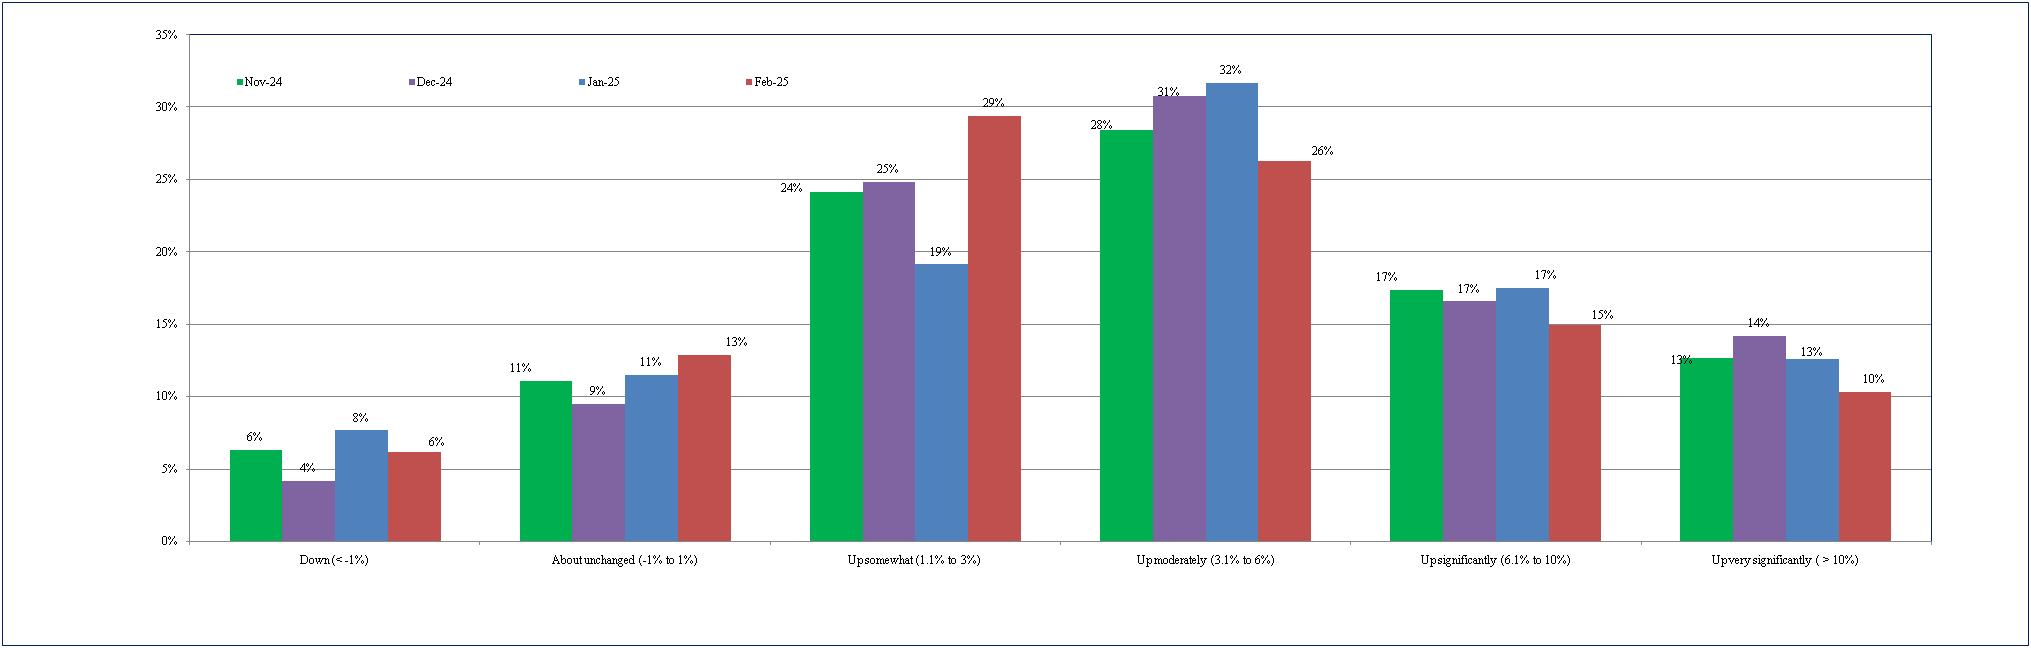
- Overall, the cost perceptions data in February 2025 indicate further moderations in cost pressures. The percentage of firms perceiving significant cost increase (over 6%) has declined to 25% in February 2025, from 30% reported in January 2025 (Chart 3).
- The percentage of firms reporting moderate cost increase (3.1% to 6%) in February 2025 has also declined to 26% from 32% reported in January 2025.
1 The Business Inflation Expectations Survey (BIES) provides ways to examine the amount of slack in the economy by polling a panel of business leaders about their inflation expectations in the short and medium term. This monthly survey asks questions about year-ahead cost expectations and the factors influencing price changes, such as profit, sales levels, etc. The survey is unique in that it goes straight to businesses - the price setters - rather than to consumers or households, to understand their expectations of the price level changes. One major advantage of BIES is that one can get a probabilistic assessment of inflation expectations and thus get a measure of uncertainty. It also provides an indirect assessment of overall demand condition of the economy. Results of this Survey are, therefore, useful in understanding the inflation expectations of businesses and complement other macro data required for policy making. With this objective, the BIES is conducted monthly at the Misra Centre for Financial Markets and Economy, IIMA. A copy of the questionnaire is annexed.
Companies are selected primarily from the manufacturing sector. Starting in May 2017, the “BIES – January 2025” is the 93 rd round of the Survey. These results are based on the responses of around 1000 companies.
- The percentage of firms reporting moderate cost increase (3.1% to 6%) in January 2025 has marginally increased to 32% from 31% reported in December 2024.
Chart 3: How do current costs per unit compare with this time last year? – % responses
C. Sales Levels
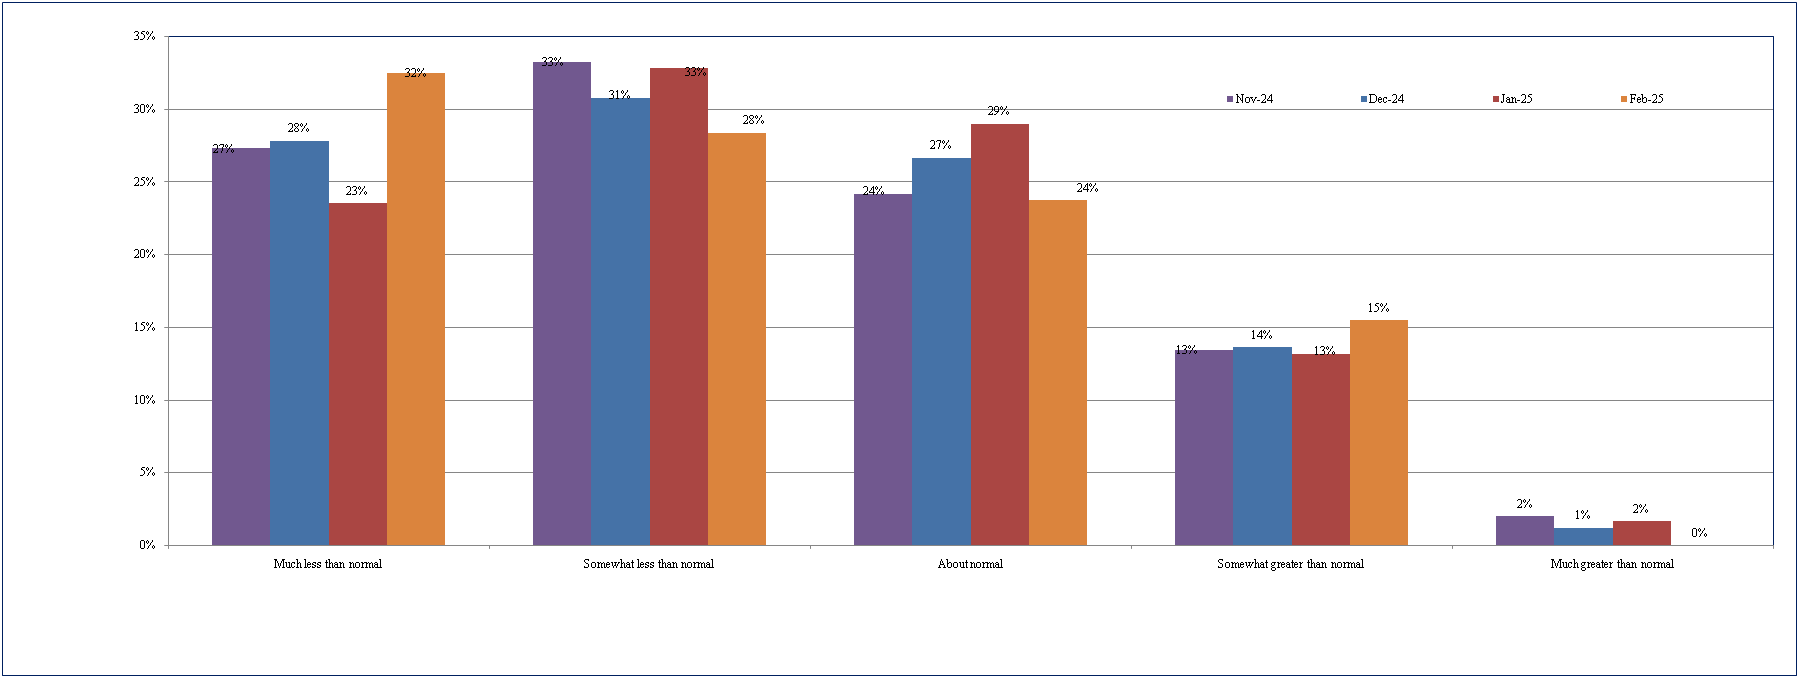
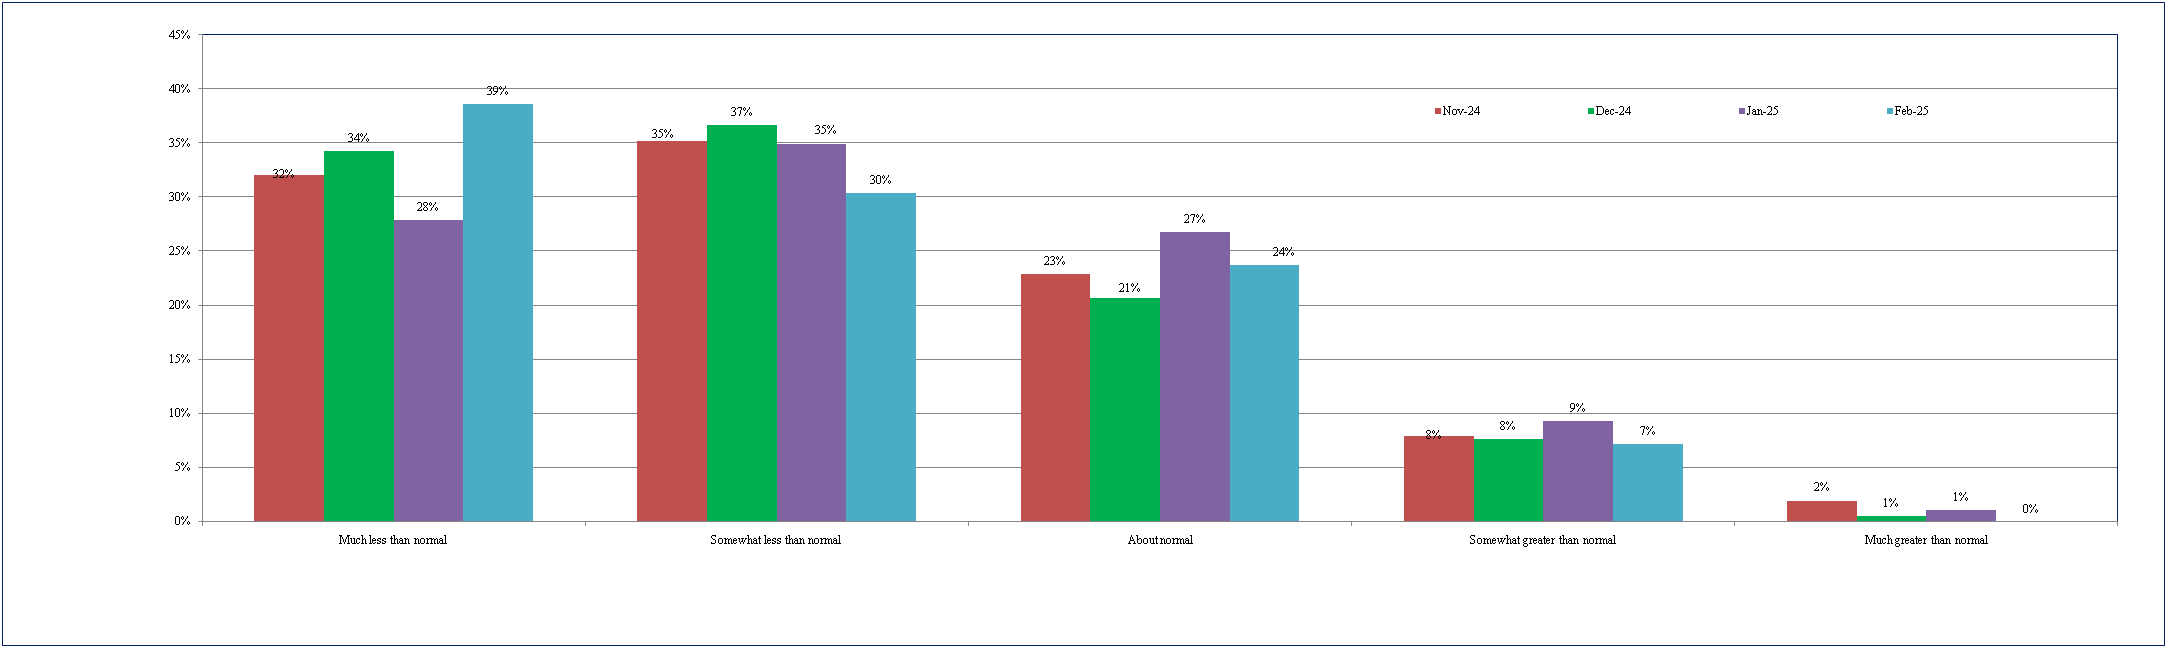
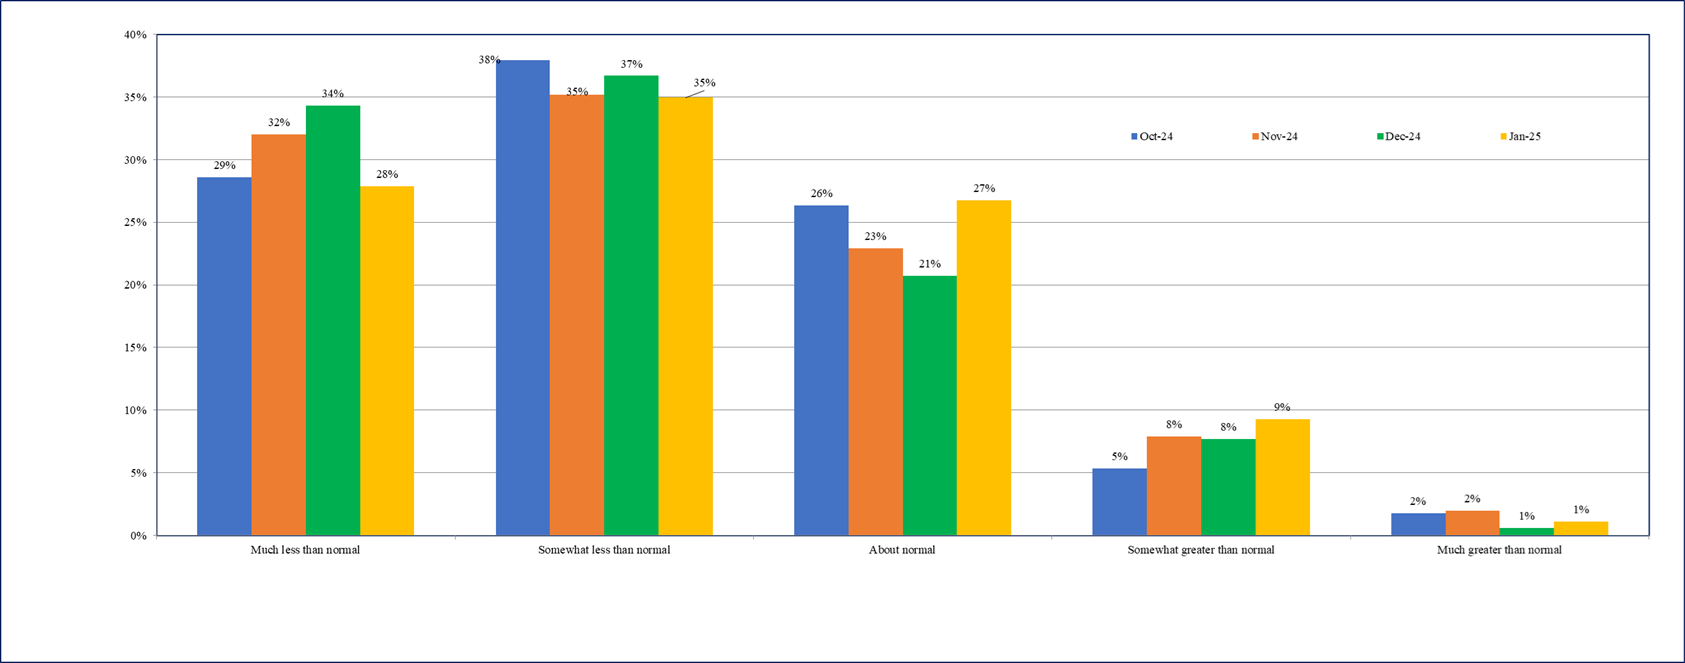
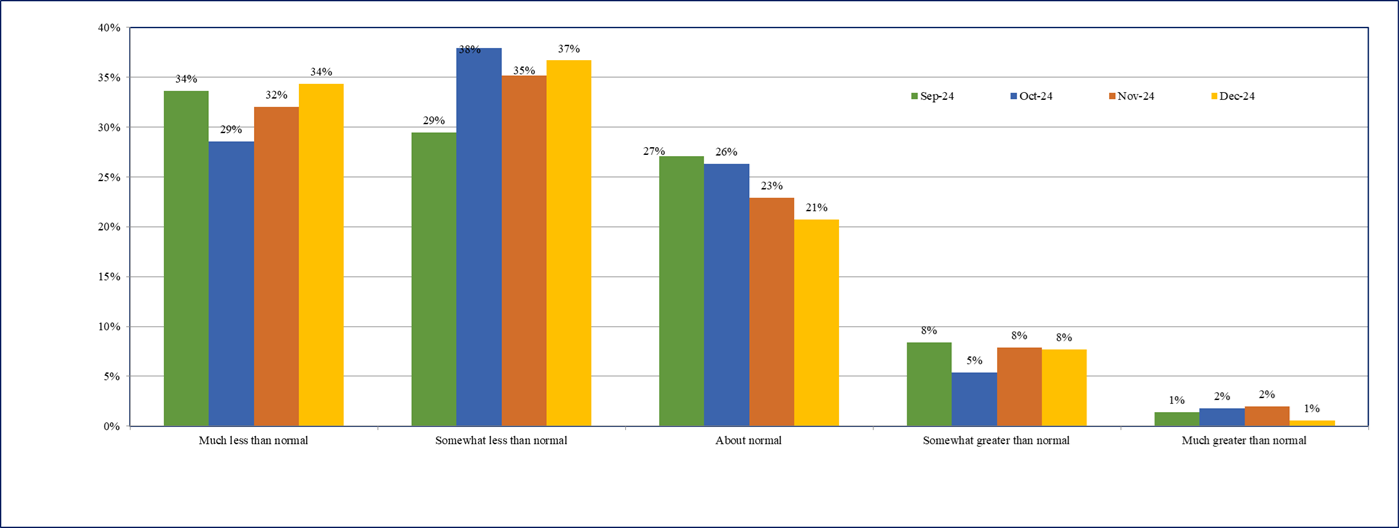
- About 32% of the firms are reporting ‘much less than normal’ sales 2 - sharply up from 23% reported in January 2025 (Chart 4).
- The percentage of firms reporting ‘somewhat less than normal’ or lower sales has also increased to around 60% in this round of the survey.
Chart 4: Sales Levels - % response
D. Profit Margins
- Around 69% of the firms are reporting ‘somewhat less than normal’ or lower profit expectations in January 2025 - sharply up from 63% reported in January 2025 (Chart 5). Overall, the firms profit margins expectations have declined in February 2025.
Chart 5: Profit Margins - % response
2"Normal" means as compared to the average level obtained in the preceding 3 years, excluding the Covid-19 period.
Business Inflation Expectation Survey (BIES) – Questionnaire
A. Current Business Conditions
Q1. How do your current PROFIT MARGINS @ compare with "normal" * times?
o Much less than normal
o Somewhat less than normal
o About normal
o Somewhat greater than normal
o Much greater than normal
Q2. How do your current sales levels compare with SALES LEVELS @ during what you consider to be
"normal" * times?
o Much less than normal
o Somewhat less than normal
o About normal
o somewhat greater than normal
o Much greater than normal
@ of the main or most important product in terms of sales.
*"normal" means the average level obtained during the corresponding time point of preceding 3 years,
excluding the Covid-19 period.
B. Current Costs Per Unit^
Q3. Looking back, how do your current COSTS PER UNIT ^ compare with this time last year?
o Down (< -1%)
o About unchanged (-1% to 1%)
o Up somewhat (1.1% to 3%)
o Up moderately (3.1% to 6%)
o Up significantly (6.1% to 10%)
o Up very significantly (> 10%)
^ of the main or most important product in terms of sales.
C. Forward Looking Costs Per Unit$
Q4. Projecting ahead, to the best of your ability, please assign a percent likelihood (probability) to the following changes to costs per unit $ over the next 12 months.
o Unit costs down (less than -1%)
o Unit costs about unchanged (-1% to 1%)
o Unit costs up somewhat (1.1% to 3%)
o Unit costs up moderately (3.1% to 6%)
o Unit costs up significantly (6.1% to 10%)
o Unit costs up very significantly (>10%)
$ of the main or most important product in terms of sales.
Values should add up to 100%.
Latest Report
Business Inflation Expectations Survey (BIES) 1 – March 2024
A. Inflation expectations
-
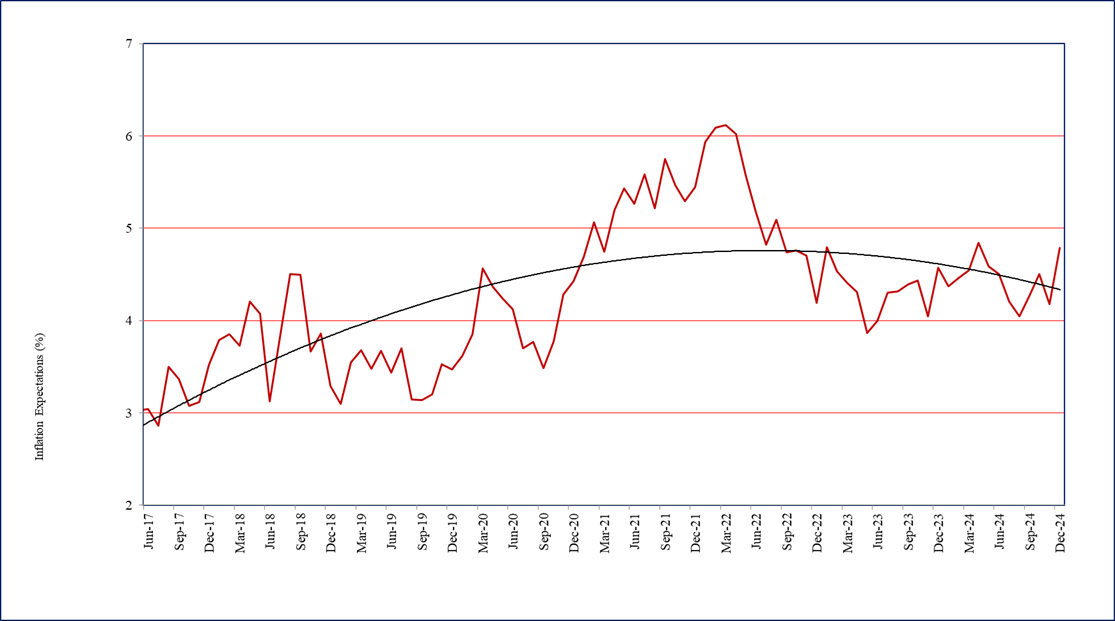
One year ahead business inflation expectation, as estimated from the mean of individual probability distribution of unit cost increase, has increased further by 9 basis points to 4.55% in March 2024 from 4.46% reported in February 2024. Average inflation expectation of the firms for the past twelve months works out to be around 4.40%. The trajectory of one year ahead business inflation expectations is presented in Chart 1.
-
The uncertainty of business inflation expectations in March 2024 as captured by the square root of the average variance of the individual probability distribution of unit cost increase, remained high around 2.1% during January-March 2024.
Chart 1: One year ahead business inflation expectations (%)

B. Costs
- The cost perceptions data in March 2024 indicate mild increase in cost pressures. However, the percentage of firms perceiving very significant cost increase (over 10%) in March 2024 has increased to 16%, from around 13% reported in February 2024 (Chart 2)
The Business Inflation Expectations Survey (BIES) provides ways to examine the amount of slack in the economy by polling a panel of business leaders about their inflation expectations in the short and medium term. This monthly survey asks questions about year-ahead cost expectations and the factors influencing price changes, such as profit, sales levels, etc. The survey is unique in that it goes straight to businesses - the price setters - rather than to consumers or households, to understand their expectations of the price level changes. One major advantage of BIES is that one can get a probabilistic assessment of inflation expectations and thus get a measure of uncertainty. It also provides an indirect assessment of overall demand condition of the economy. Results of this Survey are, therefore, useful in understanding the inflation expectations of businesses and complement other macro data required for policy making. With this objective, the BIES is conducted monthly at the Misra Centre for Financial Markets and Economy, IIMA. A copy of the questionnaire is annexed.
Companies are selected primarily from the manufacturing sector. Starting in May 2017, the “BIES – March 2024” is the 83 rd round of the Survey. These results are based on the responses of around 1100 companies.
- The percentage of firms reporting moderate cost increase (3.1% to 6.0%), on the other hand, has remained around 29% during February-March 2024.
Chart 2: How do current costs per unit compare with this time last year? – % responses

C. Sales Levels
- The sales expectations scenario during February-March 2024 remained similar. Around 18- 19% of the firms are reporting ‘somewhat greater than normal’ (Chart 3).
- About 54% of the firms are still reporting ‘somewhat less than normal’ or lower sales in March 2024 – marginally up from 52% reported in February 20242 .
Chart 3: Sales Levels - % response

"Normal" means as compared to the average level obtained in the preceding 3 years, excluding the Covid-19 period.
D. Profit Margins
-
Around 42% of the firms in March 2024 are reporting profit margins to be ‘about normal’ or greater – marginally up from 40% reported in February 2024 (Chart 4).
-
Overall, the profit margins expectations have remained somewhat muted during January- March 2024.
Chart 4: Profit Margins - % response

Business Inflation Expectation Survey (BIES) – Questionnaire
|
A. Current Business Conditions Q1. How do your current PROFIT MARGINS @ compare with "normal" * times? Q2. How do your current sales levels compare with SALES LEVELS @ during what you consider to be "normal"* times? @ of the main or most important product in terms of sales.
|
| B. Current Costs Per Unit^ Q3. Looking back, how do your current COSTS PER UNIT ^ compare with this time last year? o Down (< -1%) o About unchanged (-1% to 1%) o Up somewhat (1.1% to 3%) o Up moderately (3.1% to 6%) o Up significantly (6.1% to 10%) o Up very significantly (> 10%) ' of the main or most important product in terms of sales. |
|
C. Forward Looking Costs Per Unit$ o Unit costs down (less than -1%) $ $of the main or most important product in terms of sales. |
Latest Report
Business Inflation Expectations Survey (BIES)1 – January 2025
A. Inflation expectations
-
One year ahead business inflation expectation, as estimated from the mean of individual probability distribution of unit cost increase, has declined sharply by 55 basis points to 4.24% in January 2025 from 4.79% reported in December 2024. Firms’ average inflation expectation during the past 12 months has remained anchored around 4.43%. The trajectory of one year ahead business inflation expectations is presented in Chart 1.
-
The uncertainty of business inflation expectations in January 2025, as captured by the square root of the average variance of the individual probability distribution of unit cost increase, has remained around 1.81% in the past two rounds of the survey.
Chart 1: One year ahead business inflation expectations (%)
B. Costs
- Overall, the cost perceptions data in January 2025 indicate marginal decline in cost pressures. The percentage of firms perceiving significant cost increase (over 6%) has marginally decreased to 30% in January 2025 (Chart 2).
1 The Business Inflation Expectations Survey (BIES) provides ways to examine the amount of slack in the economy by polling a panel of business leaders about their inflation expectations in the short and medium term. This monthly survey asks questions about year-ahead cost expectations and the factors influencing price changes, such as profit, sales levels, etc. The survey is unique in that it goes straight to businesses - the price setters - rather than to consumers or households, to understand their expectations of the price level changes. One major advantage of BIES is that one can get a probabilistic assessment of inflation expectations and thus get a measure of uncertainty. It also provides an indirect assessment of overall demand condition of the economy. Results of this Survey are, therefore, useful in understanding the inflation expectations of businesses and complement other macro data required for policy making. With this objective, the BIES is conducted monthly at the Misra Centre for Financial Markets and Economy, IIMA. A copy of the questionnaire is annexed.
Companies are selected primarily from the manufacturing sector. Starting in May 2017, the “BIES – January 2025” is the 93 rd round of the Survey. These results are based on the responses of around 1000 companies.
- The percentage of firms reporting moderate cost increase (3.1% to 6%) in January 2025 has marginally increased to 32% from 31% reported in December 2024.
Chart 2: How do current costs per unit compare with this time last year? – % responses
C. Sales Levels
- About 27% of the firms are reporting ‘about normal’ sales 2 - up from 24% reported in December 2024 (Chart 3).
- The percentage of firms reporting ‘somewhat less than normal’ or lower sales has remained around 60% in the last two rounds of the survey.
Chart 3: Sales Levels - % response
2 "Normal" means as compared to the average level obtained in the preceding 3 years, excluding the Covid-19 period.
D. Profit Margins
- Around 63% of the firms are reporting ‘somewhat less than normal’ or lower profit expectations in January 2025, sharply down from 71% reported in December 2024 (Chart 4).
- Overall, the firms profit margins expectations have improved noticeably in January 2025.
Chart 4: Profit Margins - % response
2"Normal" means as compared to the average level obtained in the preceding 3 years, excluding the Covid-19 period.
Business Inflation Expectation Survey (BIES) – Questionnaire
A. Current Business Conditions
Q1. How do your current PROFIT MARGINS @ compare with "normal" * times?
o Much less than normal
o Somewhat less than normal
o About normal
o Somewhat greater than normal
o Much greater than normal
Q2. How do your current sales levels compare with SALES LEVELS @ during what you consider to be
"normal" * times?
o Much less than normal
o Somewhat less than normal
o About normal
o somewhat greater than normal
o Much greater than normal
@ of the main or most important product in terms of sales.
*"normal" means the average level obtained during the corresponding time point of preceding 3 years,
excluding the Covid-19 period.
B. Current Costs Per Unit^
Q3. Looking back, how do your current COSTS PER UNIT ^ compare with this time last year?
o Down (< -1%)
o About unchanged (-1% to 1%)
o Up somewhat (1.1% to 3%)
o Up moderately (3.1% to 6%)
o Up significantly (6.1% to 10%)
o Up very significantly (> 10%)
^ of the main or most important product in terms of sales.
C. Forward Looking Costs Per Unit$
Q4. Projecting ahead, to the best of your ability, please assign a percent likelihood (probability) to the following
changes to costs per unit $ over the next 12 months.
o Unit costs down (less than -1%)
o Unit costs about unchanged (-1% to 1%)
o Unit costs up somewhat (1.1% to 3%)
o Unit costs up moderately (3.1% to 6%)
o Unit costs up significantly (6.1% to 10%)
o Unit costs up very significantly (>10%)
$ of the main or most important product in terms of sales.
Values should add up to 100%.
Latest Report
Business Inflation Expectations Survey (BIES)1 – December 2024
A. Inflation expectations
-
One year ahead business inflation expectation, as estimated from the mean of individual probability distribution of unit cost increase, has increased sharply by 61 basis points to 4.79% in December 2024 from 4.18% reported in November 2024. This print of inflation expectation is the highest in the last 7 months. Firms’ average inflation expectation during the past 12 months, however, has remained around 4.44%. The trajectory of one year ahead business inflation expectations is presented in Chart 1.
-
The uncertainty of business inflation expectations in December 2024, as captured by the square root of the average variance of the individual probability distribution of unit cost increase, has declined further to 1.81%, from 1.89% reported in November 2024.
Chart 1: One year ahead business inflation expectations (%)
- Respondents were also asked to project one year ahead CPI headline inflation through an additional question using a probability distribution. This question is repeated every alternate month, coinciding with the month of RBI’s bi-monthly monetary policy announcement.
1The Business Inflation Expectations Survey (BIES) provides ways to examine the amount of slack in the economy by polling a panel of business leaders about their inflation expectations in the short and medium term. This monthly survey asks questions about year-ahead cost expectations and the factors influencing price changes, such as profit, sales levels, etc. The survey is unique in that it goes straight to businesses - the price setters - rather than to consumers or households, to understand their expectations of the price level changes. One major advantage of BIES is that one can get a probabilistic assessment of inflation expectations and thus get a measure of uncertainty. It also provides an indirect assessment of overall demand condition of the economy. Results of this Survey are, therefore, useful in understanding the inflation expectations of businesses and complement other macro data required for policy making. With this objective, the BIES is conducted monthly at the Misra Centre for Financial Markets and Economy, IIMA. A copy of the questionnaire is annexed.
Companies are selected primarily from the manufacturing sector. Starting in May 2017, the “BIES – December 2024” is the 92 nd round of the Survey. These results are based on the responses of around 1000 companies.
- The businesses in December 2024 expect one year ahead CPI headline inflation to be 4.96%, further up by 20 basis points from 4.76% reported in October 2024 (Chart 2). Firms’ uncertainty of CPI inflation expectations remained low at around 0.90% in December 2024.
Chart 2: Expected CPI headline inflation (%) - one year ahead
B. Costs
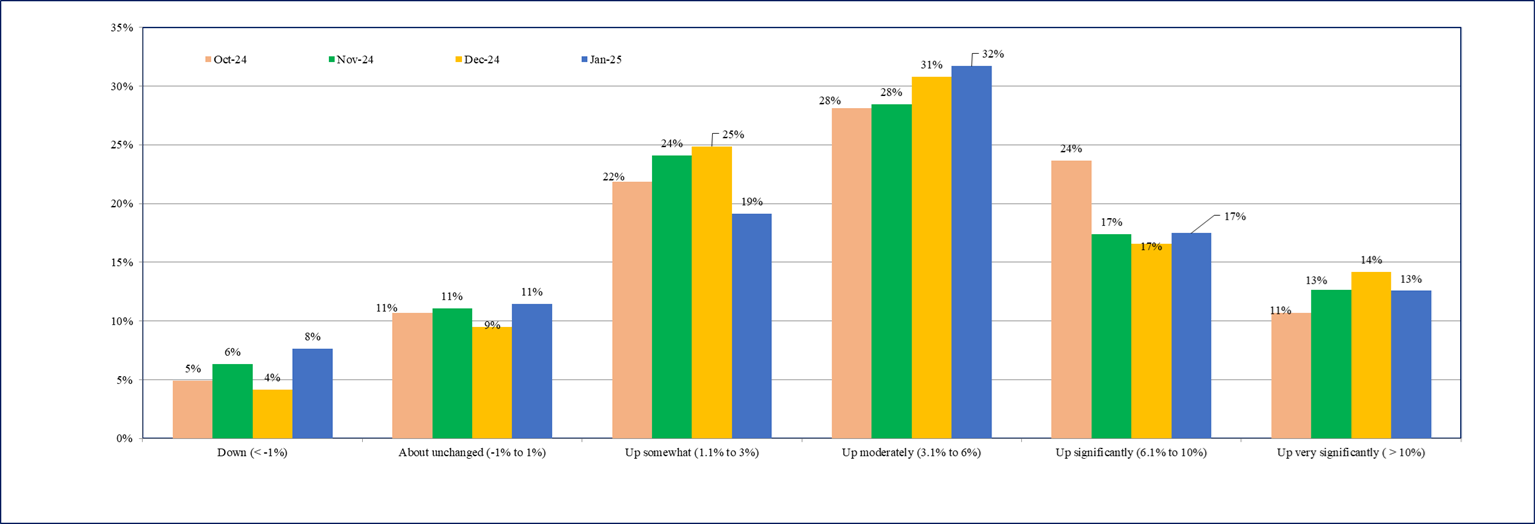
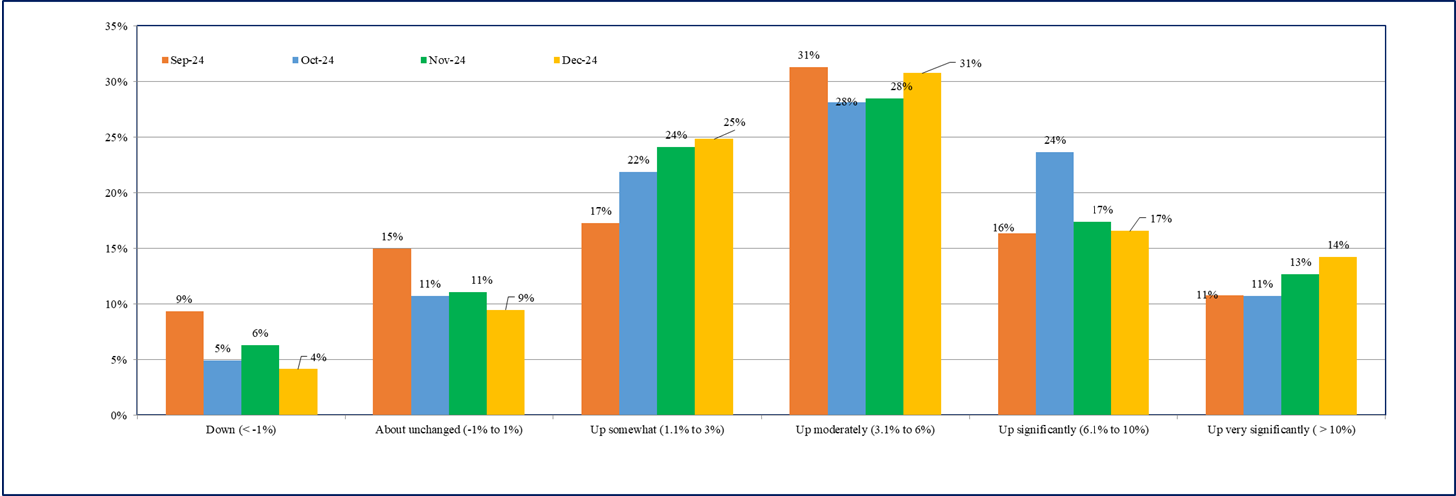
- Overall, the cost perceptions data in December 2024 indicate increase in cost pressures. The percentage of firms perceiving significant cost increase (over 6%) has marginally increased to 31% in December 2024 (Chart 3).
- The percentage of firms reporting moderate cost increase (3.1% to 6%) in December 2024 has also increased to 31% from around 28% reported during the past three rounds of the survey.
Chart 3: How do current costs per unit compare with this time last year? – % responses
C. Sales Levels
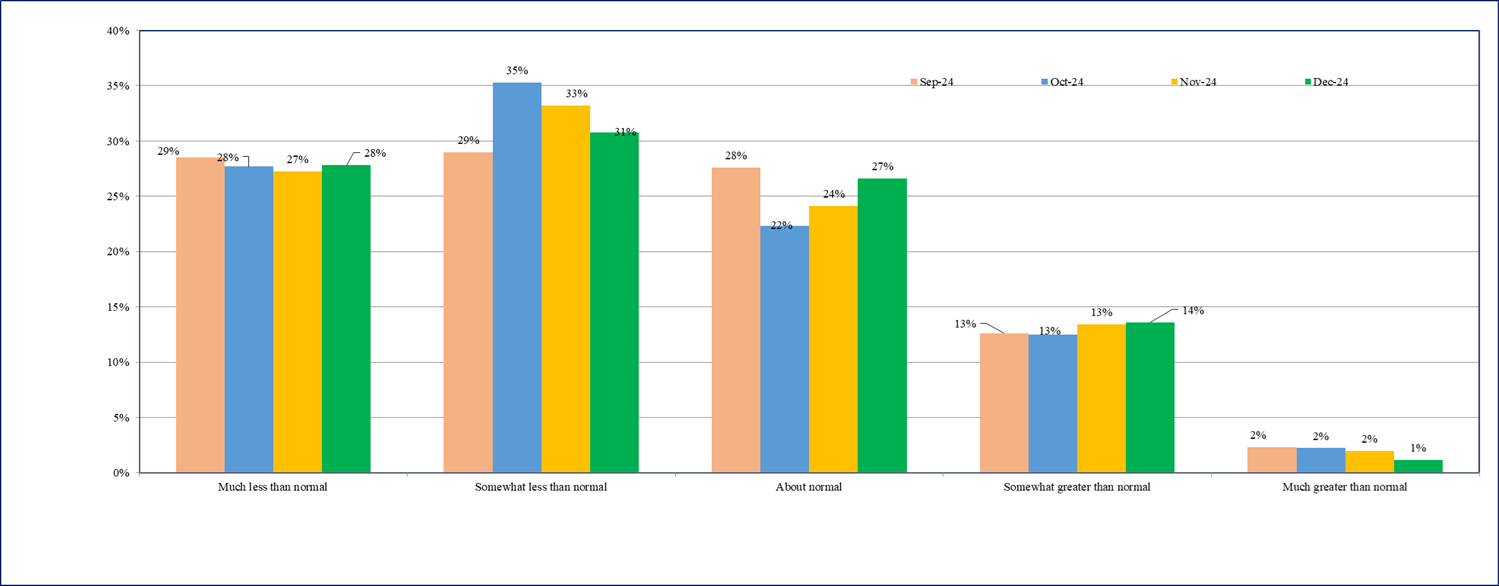
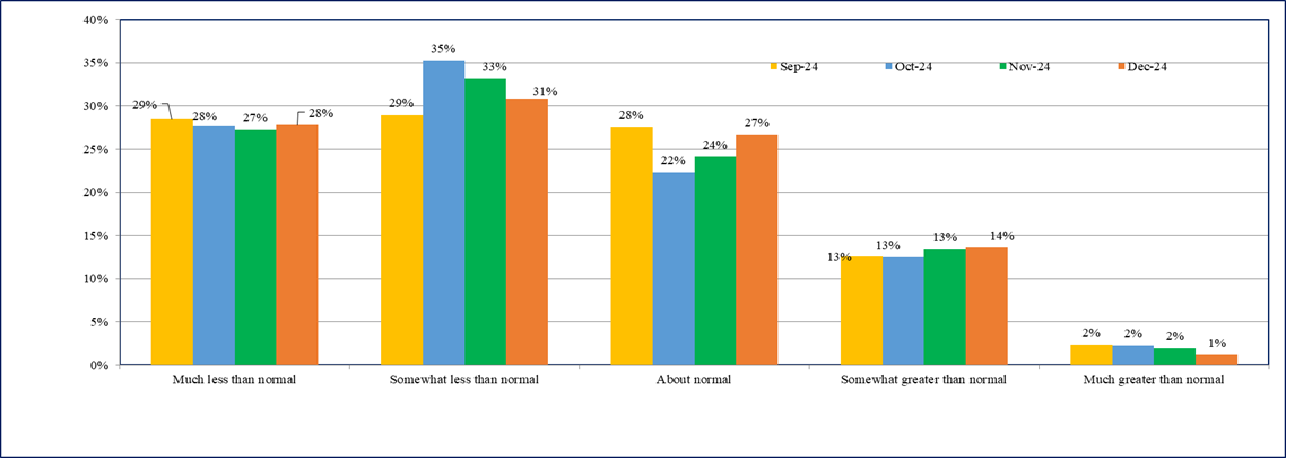
- About 28% of the firms are still reporting ‘much less than normal’ sales 2 (Chart 4).
- The percentage of firms reporting ‘somewhat less than normal’ or lower sales has remained around 60% in the last two rounds of the survey..
Chart 4: Sales Levels - % response
D. Profit Margins
- Over 71% of the firms are reporting ‘somewhat less than normal’ or lower profit expectations in December 2024, further up from 67% reported in the last two rounds (Chart 5).
- Overall, the profit margins expectations continue to remain subdued in December 2024.
Chart 5: Profit Margins - % response
2"Normal" means as compared to the average level obtained in the preceding 3 years, excluding the Covid-19 period.
Business Inflation Expectation Survey (BIES) – Questionnaire
A. Current Business Conditions
Q1. How do your current PROFIT MARGINS @ compare with "normal" * times?
o Much less than normal
o Somewhat less than normal
o About normal
o Somewhat greater than normal
o Much greater than normal
Q2. How do your current sales levels compare with SALES LEVELS @ during what you consider to be
"normal" * times?
o Much less than normal
o Somewhat less than normal
o About normal
o somewhat greater than normal
o Much greater than normal
@ of the main or most important product in terms of sales.
*"normal" means the average level obtained during the corresponding time point of preceding 3 years,
excluding the Covid-19 period.
B. Current Costs Per Unit^
Q3. Looking back, how do your current COSTS PER UNIT ^ compare with this time last year?
o Down (< -1%)
o About unchanged (-1% to 1%)
o Up somewhat (1.1% to 3%)
o Up moderately (3.1% to 6%)
o Up significantly (6.1% to 10%)
o Up very significantly (> 10%)
^ of the main or most important product in terms of sales.
C. Forward Looking Costs Per Unit$
Q4. Projecting ahead, to the best of your ability, please assign a percent likelihood (probability) to the following
changes to costs per unit $ over the next 12 months.
o Unit costs down (less than -1%)
o Unit costs about unchanged (-1% to 1%)
o Unit costs up somewhat (1.1% to 3%)
o Unit costs up moderately (3.1% to 6%)
o Unit costs up significantly (6.1% to 10%)
o Unit costs up very significantly (>10%)
$ of the main or most important product in terms of sales.
Values should add up to 100%.
Reports Archival
Reports Archival
2026 Results
Summary Data
Consolidated excel file containing all the previous months survey results - Bies - Results.
Take the Survey
In case you are interested in taking the survey, please send an email to bies@iima.ac.in
Subscribe/Comment
In case you have any comments/suggestions for the project, please send an email to bies@iima.ac.in
